

Microsoft Excel 2019 Tutorial
Microsoft Excel version 2019 is filled with upgrades and different collection of new features that add a lot more improvements and convenience to the workflow. This post explains what in new and how you may benefit.
6 New Functions
Microsoft Excel 2019 has added six new functions that are useful to perform various mathematical functions. They are:
- CONTACT
- MAXIFS
- MINIFS
- TEXTJOIN
- IFS
- SWITCH
Although explaining all of the above six function is beyond the scope of this post, however, one of the new functions – IFS – requires some emphasis as to how this formula is simplified now. The new IFS function is simple and sophisticated to write now. Previously it required more than one IF functions put together in the formula. Now in the simplified form you write IFS only once inside the formula. See below how the difference.
Previous form =IF(A1=1,”Blue”,IF(A1=2,”Yellow”,IF(A1=3,”Green”,)))
New Form =IFS(A1=1,”Blue”,A1=2,”Yellow”,A1=3,”Green”)
The new simple IFS function in Microsoft Excel version 2019 is short and easy to remember and implement that in result ensures fast and efficient workflow reducing the chances of error.
Improved Auto Complete Function
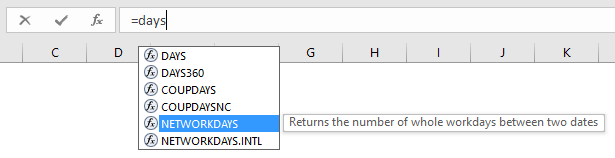
MS Excel 2019 comes with improved Auto complete function. This means when entering a formula you need not be precise or spelling the function exactly in the correct way to find what you are looking for. Excel AutoComplete Function will look for you the related functions and will guide you to pick from the desired functions suggested in the drop down window. This improvement is immensely helpful on occasions when you are unable to recall what you are looking for.
Enhanced Visual Updates
Some of the improvements included in MS Word 2019 are part of Excel 2019 also. For example inclusion of Scalable Vector Graphics (SVGs) that you may insert in your documents. You may enlarge them without losing quality of the actual image, change color and rotate as required.
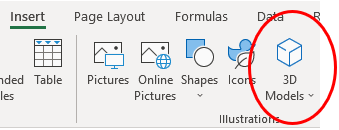
Then there are 3D models that you may insert in your Excel documents. In MS Excel 2019 this is another visual enhancement to add meaning and value to your documents. To get access to SVG graphics and 3D models, go to ‘Insert’ tab on the ribbon and there you find them.
5 New Chart to Display Data
When talking about charts and graphs to display your data what first come to mind are traditional looking pie chart or column chart that we all have been using to represent out financial or other data. These conventional charts are still there in Excel, however, MS Excel 2019 release features 5 new charts to display data in new ways.
- Pareto Charts
Histograms show frequencies (e.g. how much of one item is sold against the other). They are based on values that are allocated into different bins. Pareto charts go one step ahead by allowing to sorting frequencies and adding a cumulative percentage line to give you a trend through the data.
- Sunburst Charts
Sunburst is a basically a new form of pie or donut chart to show hierarchical structure where each level of hierarchy is represented through a ring or a circle. The circle in the center is the top level and it works its way round.
- Tree map Charts
This chart helps you show data in a tree like structure. Like pie or sunburst charts, the tree map chart also represents various data points as a part of the whole. However, the tree map chart uses rectangles instead of slices and rings.
- Funnel
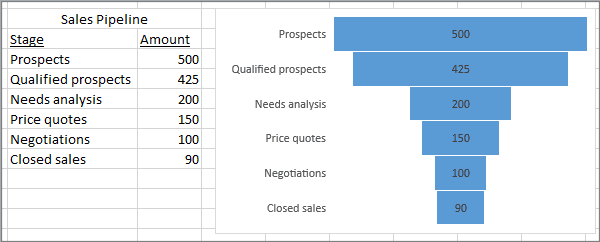
Since the data in this type of chart is in descending order that is why the visual representation is of funnel type where data decreases in each step. With Funnel charts you can tell a story for example how a business went from receiving 700 customers contacts during a certain period to closing sales on 50 of these contacts. There is no axis in funnel chart.
- 2D Data Map
If your data is based on geographical details like population, area, cities and postal codes then 2D map chart is best solution to present your data. This chart is perfect to tell a company sales report especially when a company have clients in different parts of the world.
Linking Documents
Hyperlinks are not new, but adding a hyperlinks to a document in Excel earlier versions have not been that smooth. On the ‘Insert’ tab now you can add hyperlinks to recently used cloud-based files or websites. To add a link, click the ‘Link’ and choose any file from the displayed list.
CSV improvements
“This file may contain features that are not compatible with CSV…”?
You may have often come across this warning which at times is found to be irritating. In Excel 2019 Microsoft has decided to scrap it when you are working in Excel and want to save a file in CSV format. In addition, now you can open and save CSV files using UTF-8 character encoding. For that purpose follow the path: File > Save As > Browse and then click the ‘Save as type’ menu, and you’ll find the new option for ‘CSV UTF-8 (Comma delimited)’.
External Data Navigator
The new Navigator dialog box Microsoft Excel version 2019 makes it easy to work with the external data that you intend to import into your worksheets. While performing external data queries with text files, web pages, or other external data sources (e.g. Microsoft Access database files), the Navigator dialog box allows you to preview the data that you are about to download as well as to specify where and how they are downloaded.
Personalize Default Pivot Table Layouts
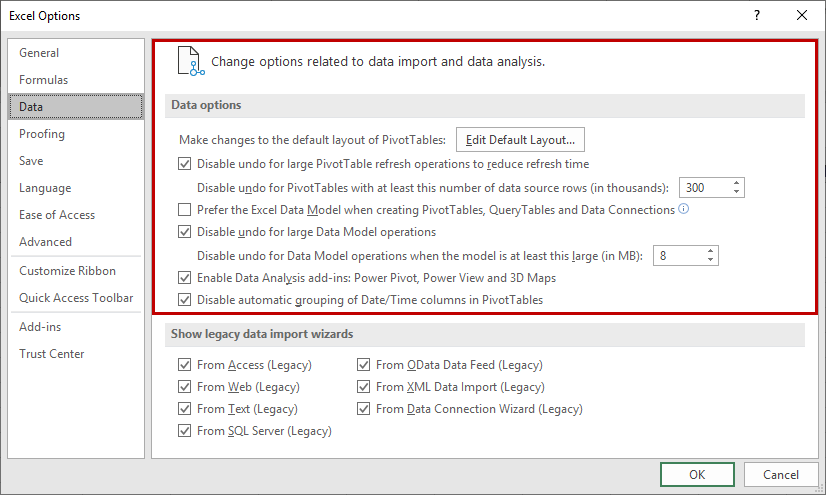
In MS Excel 2019 you can personalize default layout for all new Pivot Tables you create. Go to File>Options and in the left hand side of the window you can access ‘Data’ option where you may select and store default settings for Pivot Tables. Once you set up these options, they will determine how all future Pivot Tables that you create will appear. Interestingly, your new default settings are not going to impact the Pivot Tables that you created in the past. In addition to layouts there are eight more enhancements to PivotTable, they are:
- Automatic relationship detection
- Creating, editing, and deleting custom measures
- Automatic time grouping
- PivotChart drill-down buttons
- Search in the PivotTable
- Smart renaming
- Multi-select Slicer
- Faster OLAP PivotTables
Microsoft Excel version 2019 comes with some general improvements across the Get & Transform area. One prominent enhancement is the new ‘Queries & Connections’ side pane, that allows you manage queries and connections more easily.
Useful links for Microsoft Office Apps – 2019 Tutorials:
Microsoft Word Tutorial – 2019